


When building a reliable backup power strategy, understanding the technical nuances of your energy storage is the difference between a seamless transition and a dark house. Whether you are utilizing a solar power generator for weekend camping or a whole home power generator for emergency preparedness, the heart of the system is the battery. Specifically, for those using traditional deep-cycle cells, the lead acid discharge curve is the most critical map you possess.
Our team at Nature’s Generator focuses on empowering users with the data they need to manage their energy effectively. This guide will decode exactly how lead acid batteries behave under load, how to interpret voltage drops, and how to optimize your system for maximum longevity.
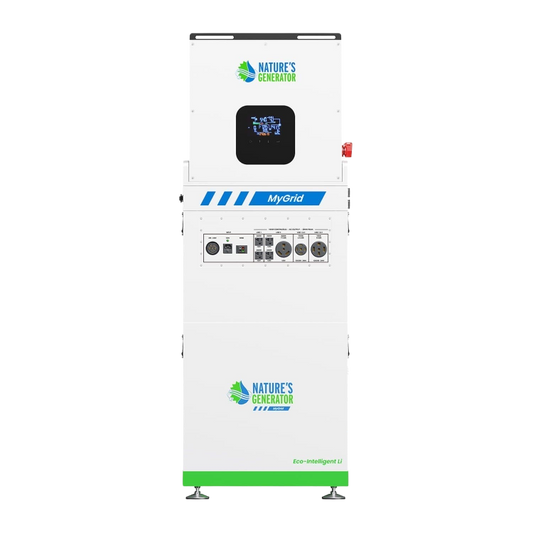
Why is understanding the lead acid discharge curve critical for your off-grid power system?
For many homeowners, a battery is a "black box"—energy goes in, and energy comes out. However, lead acid chemistry is highly dynamic. Unlike a fuel tank that shows a linear decrease in volume, a battery's available energy changes based on how fast you pull power from it. The lead acid discharge curve is a graphical representation of how the battery’s voltage drops as it is depleted over time.
Based on our experience, failing to understand this curve leads to two major issues: premature battery failure and unexpected power shutdowns. If you assume 12.0V means your battery is still half full, you might be in for a surprise when the inverter cuts out under a heavy load. By mastering—or rather, gaining full proficiency in—interpreting these charts, you can accurately predict how many hours of run-time you have left for essential appliances like refrigerators or medical devices.
In an off-grid scenario, your Power Pod serves as the primary reservoir. Understanding the discharge curve allows you to set realistic expectations for your energy budget, ensuring that you don't over-drain the system and cause permanent chemical damage to the lead plates.
How do you read a lead acid discharge chart to estimate remaining battery life?
Reading a discharge curve requires looking at the relationship between Voltage (the vertical axis) and the Depth of Discharge (DoD) or Time (the horizontal axis). A typical 12V lead-acid battery is not actually 12.0V when full; it sits at approximately 12.6V to 12.8V.
As you begin to draw power, the curve follows three distinct phases:
-
The Initial Drop: A sharp but brief decline from the surface charge (rested voltage) to the operating voltage.
-
The Plateau: This is the longest part of the curve. The voltage declines slowly and steadily as the battery provides the bulk of its capacity. This is where most of your work happens.
-
The Knee: Toward the end of the capacity (usually around 11.4V to 11.6V), the curve drops off a cliff. Once you hit the knee, the voltage plummets rapidly, and continuing to draw power can cause "reversal" or heavy sulfation.
Our team recommends that off-grid users aim to stay within the plateau. If you notice your voltage dipping toward 12.0V under a moderate load, you have reached roughly 50% DoD. This is the sweet spot for lead-acid longevity. Pushing past this into the knee phase significantly reduces the number of cycles your battery can handle before it needs replacement.
Why does your battery seem to "die" faster under heavy loads?
A common question we receive from customers is: "Why does my battery last 10 hours with a small light, but only 30 minutes with a space heater?" The answer lies in Peukert’s Law.
The lead acid discharge curve is not static; it changes based on the "C-rate" (the rate of discharge). A battery rated for 100 Amp-hours (Ah) is usually rated at a 20-hour rate (5 Amps per hour). If you pull 50 Amps instead, you won't get 2 hours of power; you might only get 1 hour. This is because high current draws increase internal resistance and heat, which effectively "hides" some of the battery’s capacity.
Real-World Scenario: Imagine you are using a Nature’s Generator Gold System to run a 1,000W microwave. The high amperage will cause a temporary voltage sag. On your discharge curve, this looks like a sudden dip. If you stop the microwave, the voltage will bounce back slightly. Based on our experience, users panic during this sag, thinking the battery is dead. Understanding the curve helps you distinguish between a temporary sag caused by a high load and a true state of depletion.
How does Depth of Discharge (DoD) impact the long-term ROI of your solar backup?
When deciding on a whole home power generator solution, the Return on Investment (ROI) is largely determined by battery life. Lead acid batteries are "consumables," but their lifespan is entirely in your hands.
The discharge curve dictates the "50% Rule." While a lead acid battery can be discharged to 80% or 100%, doing so repeatedly is catastrophic.
-
10% - 20% DoD: The battery might last 3,000 cycles.
-
50% DoD: The battery might last 1,000 cycles.
-
80% - 100% DoD: The battery might fail in as little as 200 cycles.
By monitoring your discharge curve and ensuring you don't drop below the 12.0V - 12.1V mark (under a resting state), you effectively double or triple the life of your investment. This is why we suggest adding extra Power Pods to your array. By increasing the total capacity, you ensure that even your highest energy-use days only take a small "bite" out of each battery's curve, keeping the DoD shallow and the lifespan long.
What real-world factors cause your discharge curve to fluctuate?
In a laboratory, the discharge curve is a perfect line. In your garage or backyard, it is affected by the environment. The most significant factor is temperature.
-
Cold Weather: In freezing temperatures, the chemical reactions inside the battery slow down. The discharge curve will appear "compressed." You will see a lower voltage for the same amount of capacity, and the battery will reach the "knee" much faster.
-
Heat: While heat can slightly increase the capacity in the short term, it accelerates the internal degradation (corrosion) of the lead plates.
Customer Feedback Tip: We have seen users in northern climates build insulated (but ventilated) boxes for their backup systems. This keeps the batteries closer to the ideal 77°F (25°C) operating temperature, ensuring the discharge curve remains predictable. If you are using your solar power generator in the winter, always account for a 20-30% reduction in effective capacity due to the temperature's effect on the curve.
How do Nature’s Generator systems simplify battery management for the average homeowner?
Technical charts and voltage readings can be overwhelming for those who just want reliable backup power. This is where the integrated engineering of Nature’s Generator comes into play.
Our systems are designed to interpret the complexities of the lead acid discharge curve for you. Instead of requiring you to carry a multimeter and a Peukert’s Law calculator, our units feature:
-
Intuitive LCD Displays: We translate voltage and discharge rates into a simple percentage or bar-style fuel gauge that accounts for the curve’s non-linear nature.
-
Built-in Protection: To prevent you from hitting that "deadly knee" at the end of the discharge curve, our smart inverters include an Automatic Low Voltage Disconnect (LVD). This safely shuts off power before the battery sustains permanent damage.
-
Scalability: If your discharge curve is dropping too fast for your needs, our "plug-and-play" architecture allows you to link more batteries in parallel. This spreads the load, reduces voltage sag, and keeps you in the high-efficiency plateau of the curve.
By choosing a pre-configured system, you benefit from the expertise of our team, which has already calibrated the hardware to match the specific discharge characteristics of the sealed lead-acid (SLA) or AGM batteries used in our products.
Turning Technical Data into Off-Grid Confidence
Understanding the lead acid discharge curve is the key to transitioning from a passive user to an expert manager of your own power utility. By recognizing the phases of discharge—from the initial plateau to the critical "knee"—you can protect your investment and ensure your home stays powered when it matters most.
Remember these three takeaways:
-
Respect the 50% mark: Aim to keep your rested voltage above 12.0V to maximize cycle life.
-
Account for the Load: Don't let temporary "voltage sag" from high-wattage appliances fool you into thinking your batteries are empty.
-
Manage the Environment: Keep your batteries at a moderate temperature to ensure the curve remains consistent.
We are committed to providing the most user-friendly reliable backup power solutions on the market. Whether you are looking for a portable solar power generator for your next trip or a robust system to run your appliances during a blackout, we have the hardware and the expertise to help you succeed.


